
Connect to databases, upload Excel files, and create powerful visualizations in seconds. Enterprise-grade analytics made simple. No SQL required. No coding needed.
ChartIQ is an AI-powered data visualization platform built for enterprise teams in India. Simply ask questions in plain English, and ChartIQ instantly generates professional charts and dashboards from your databases or Excel files—eliminating the complexity of traditional BI tools.

Explore how ChartIQ transforms your enterprise data workflow
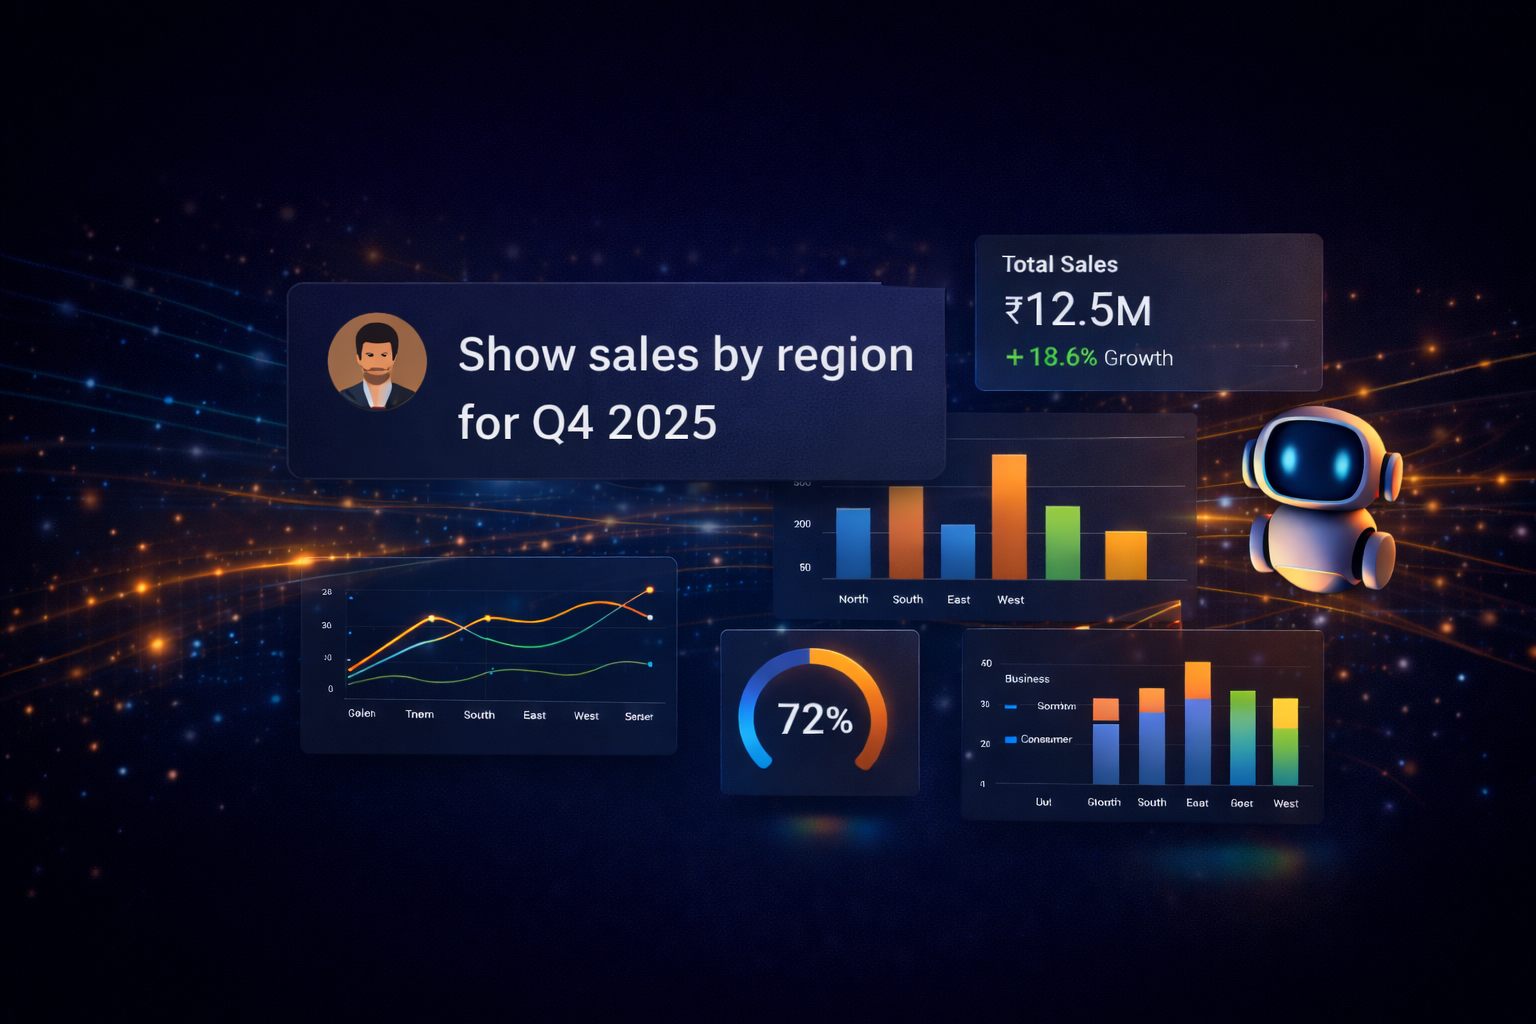
Ask questions like 'Show sales by region' and get instant visualizations.
Our AI translates natural language into complex SQL and beautiful charts automatically
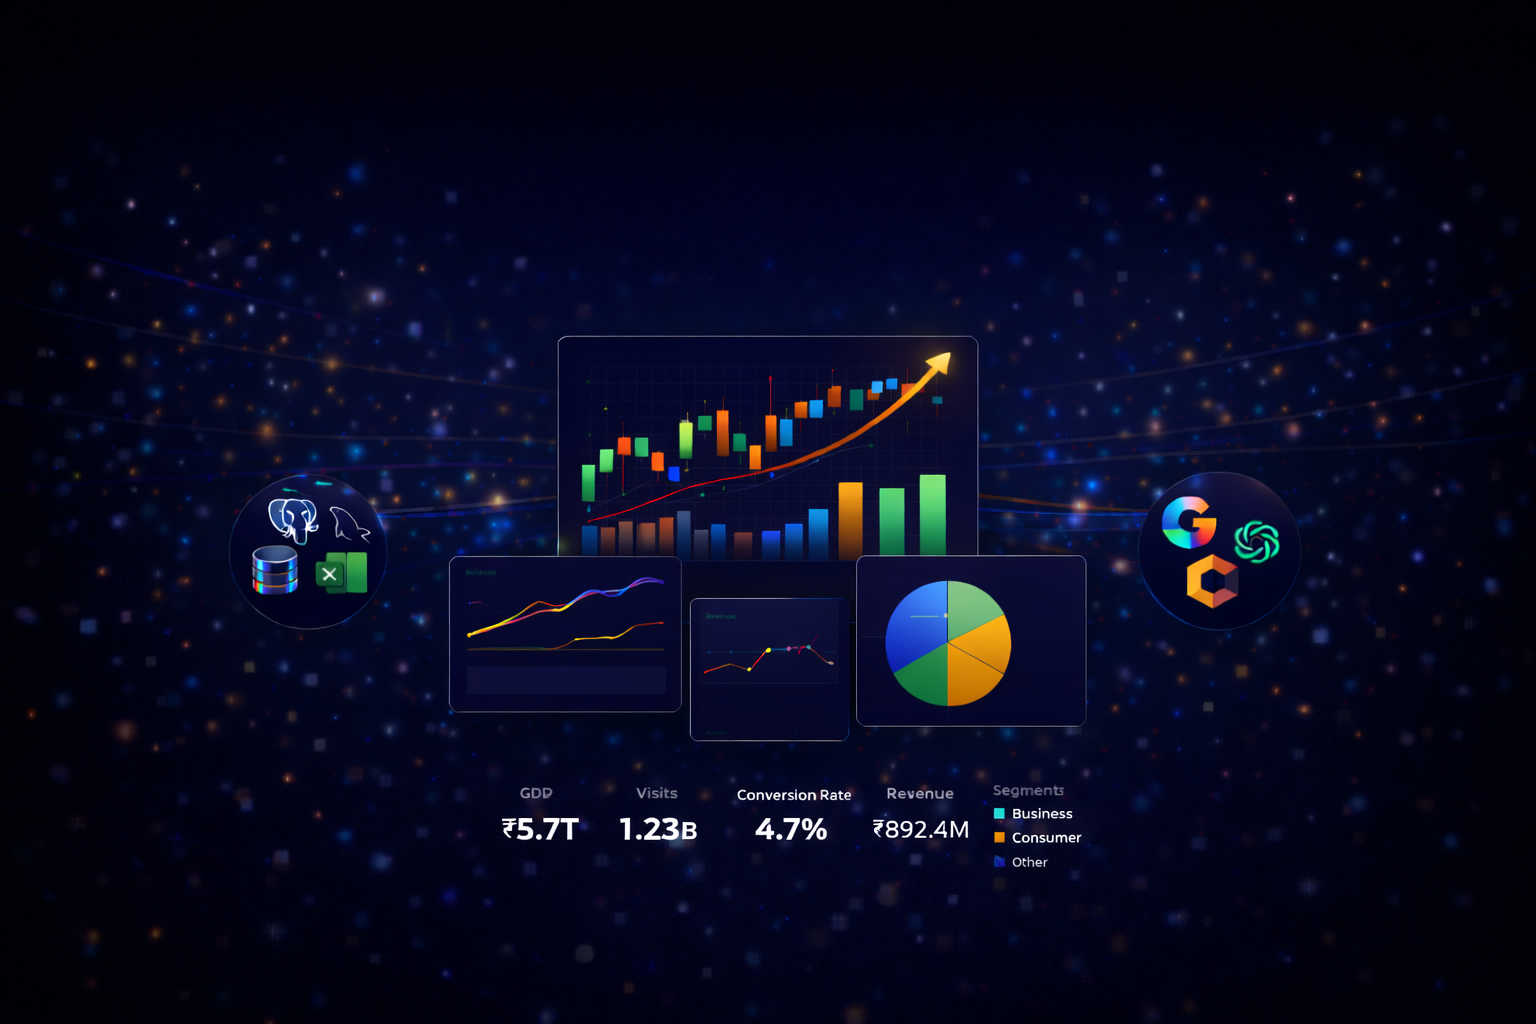
Connect to PostgreSQL, MySQL, SQL Server, Oracle, or upload Excel files.
ChartIQ bridges the gap between fragmented data sources into a single unified view.
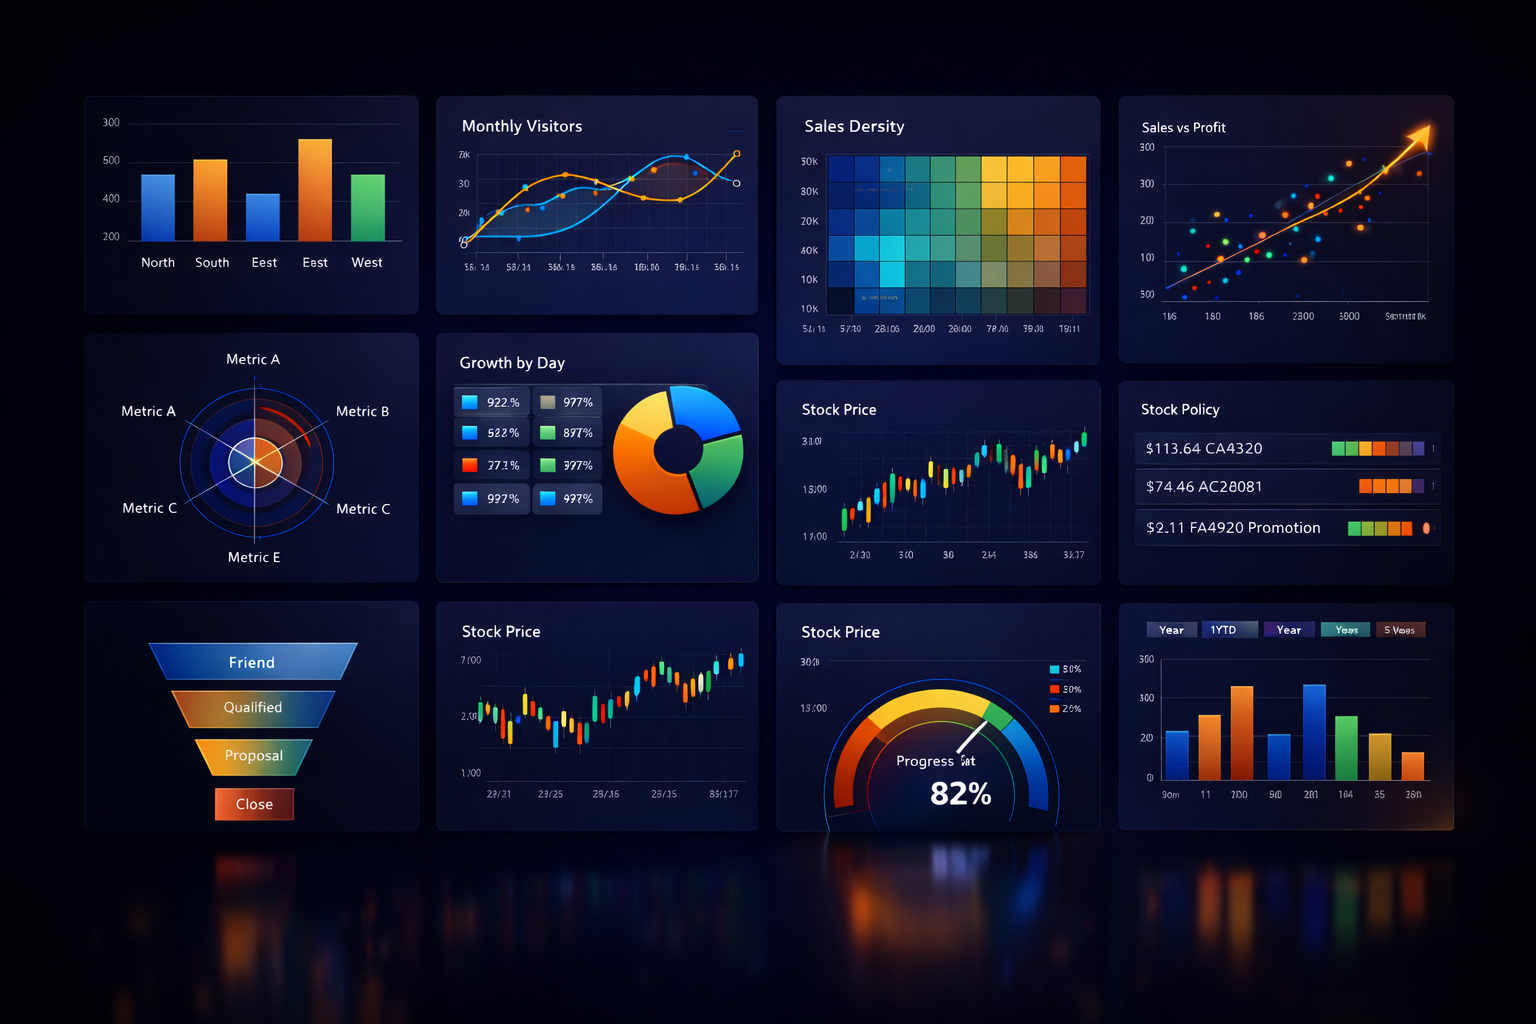
From classic bar and line charts to complex scatter, radar, and heatmaps.
Every visualization is professionally styled and ready for executive presentations.

Browse tables and understand your schema in spreadsheet format.
Our engine automatically detects relationships and suggests relevant metrics.
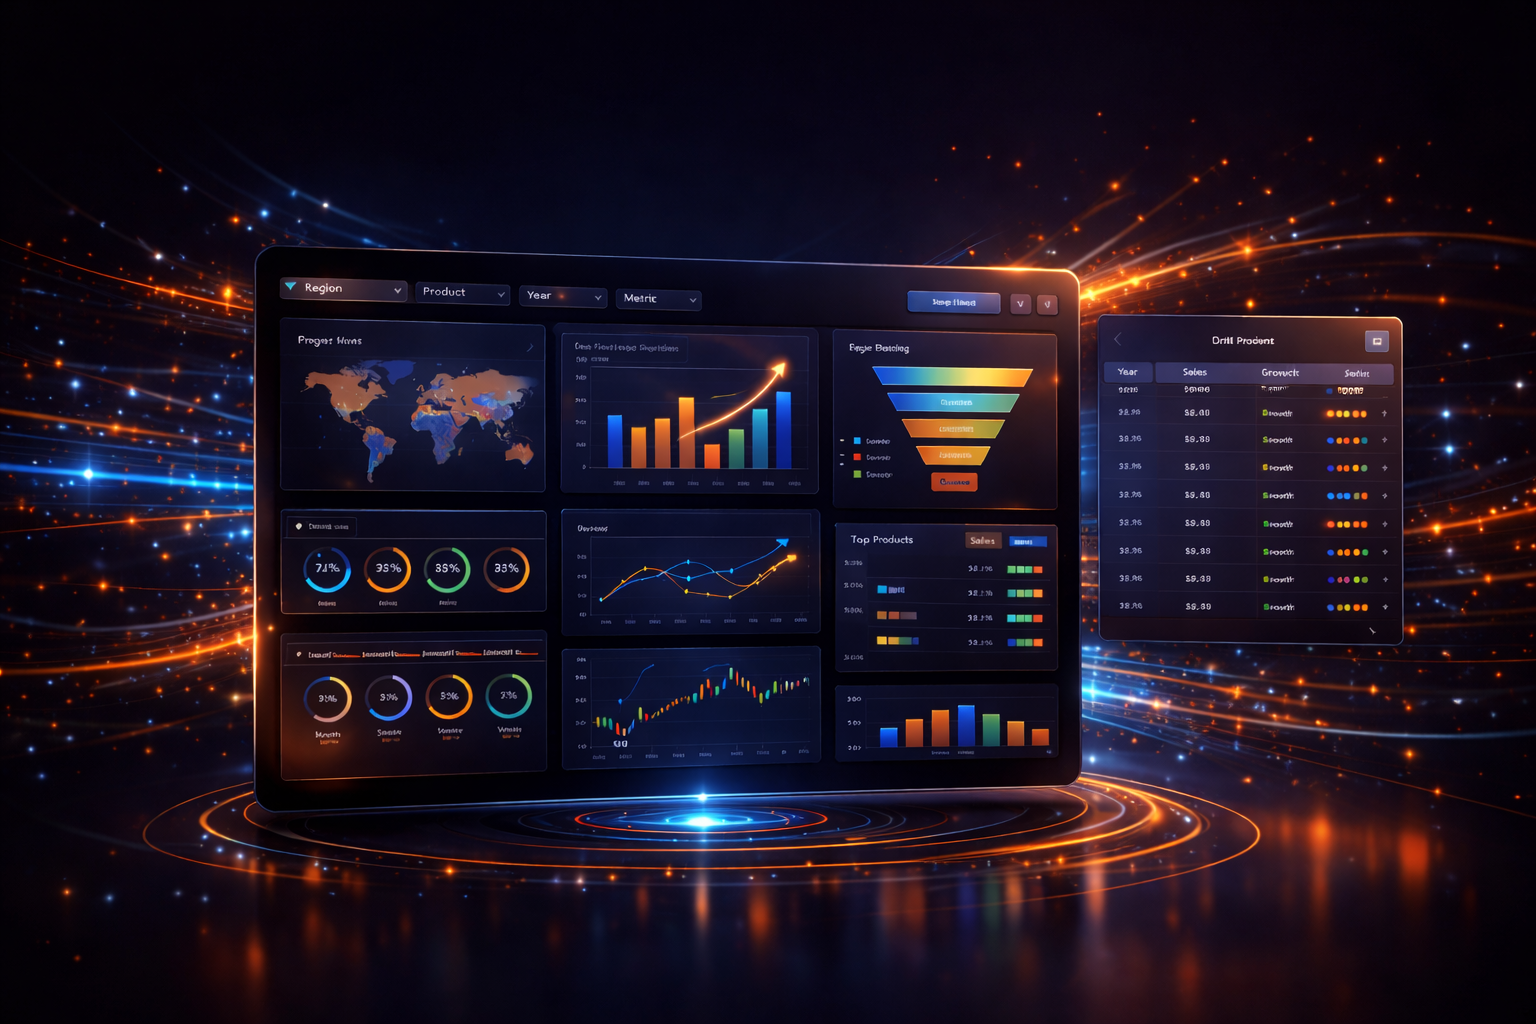
Combine charts into interactive dashboards with filters and drill-downs.
Create mission-control centers for your business in minutes, not days.
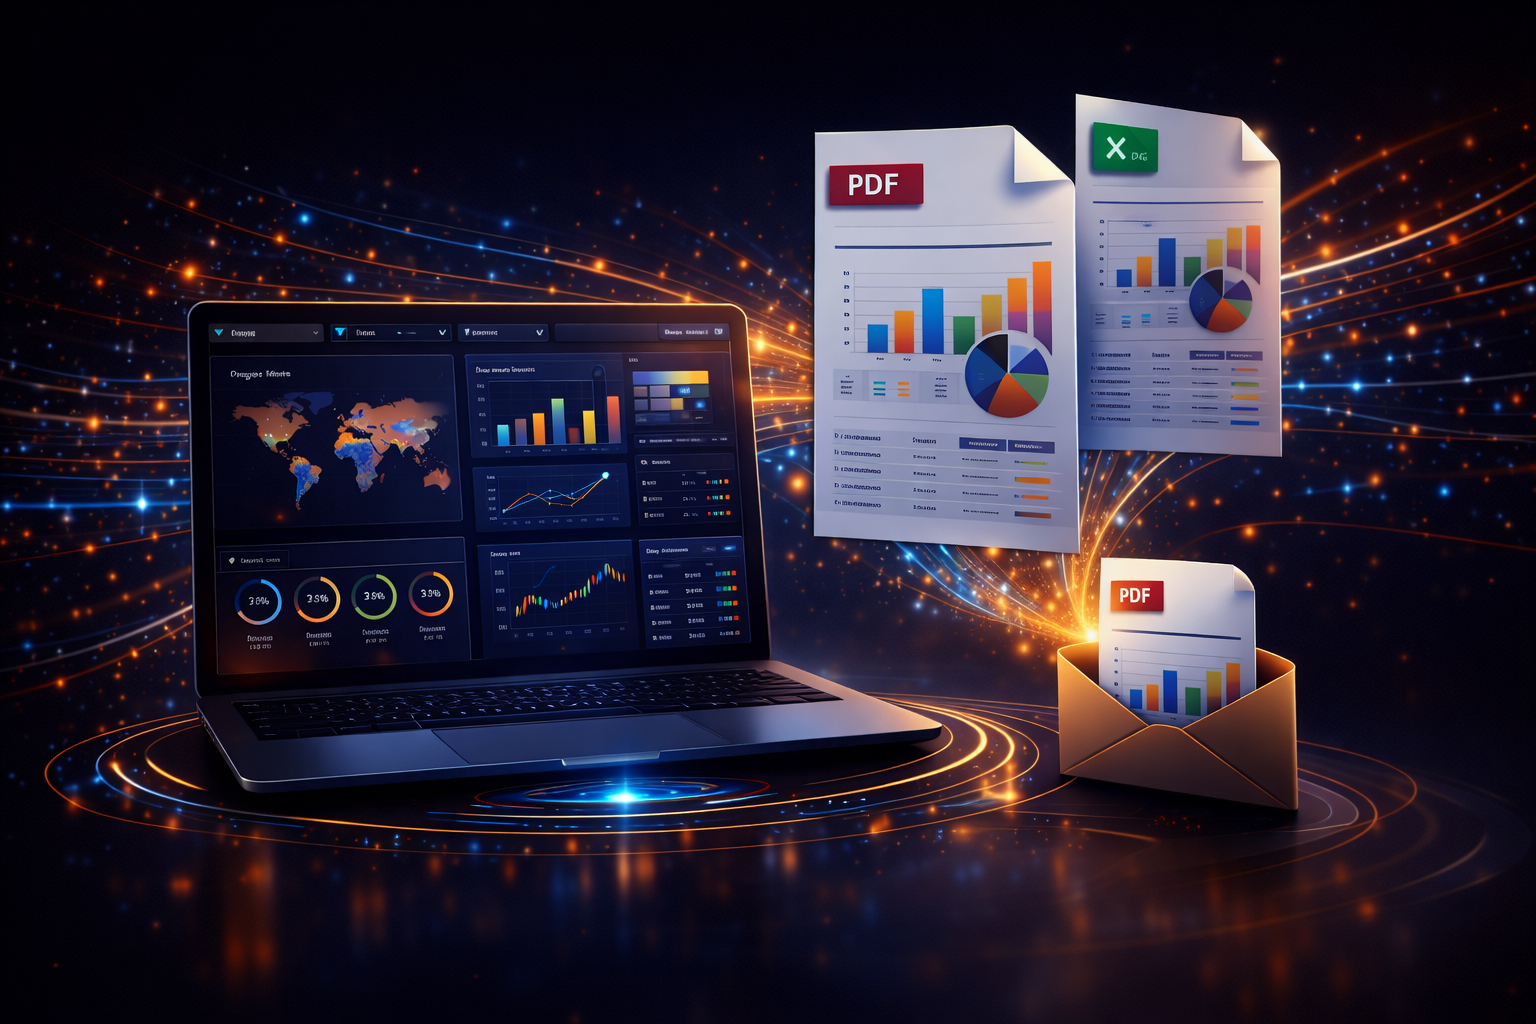
Automate daily or weekly PDF/Excel reports to stakeholders.
Ensure your team stays aligned with consistent updates delivered straight to their inbox.

Tailored analytics experiences for diverse enterprise needs.

Track asset performance and risk metrics with automated visualizations
Identify high-value customers and shifting transaction patterns instantly.
Automate regulatory reporting and monitor loan disbursement trends.

Visualize real-time output by facility and specific product line.
Analyze defect rates and equipment downtime for better maintenance.
Monitor stock levels, reorder points, and supplier delivery performance.

Monitor admission and discharge trends across departments in real-time.
Track bed, equipment, and staff utilization to improve efficiency.
Analyze treatment outcomes and recovery times to elevate care

Monitor headcount and attrition rates by department and region.
Analyze time-to-hire metrics and the talent acquisition pipeline.
Track skill gaps, training completion, and
diversity metrics.

Track revenue across product categories, stores, and digital channels.
Analyze purchase frequency and marketing ROI for better targeting
Monitor inventory turnover and seasonal trends to prevent stock-outs.